Test Insight and Statistics
Nowadays, continuous testing is adopted by the development teams widely. QuickBuild can help the team to analyze the test results to quickly and easily.
Build test reports can help the team to know:
- which tests were fixed/not fixed/new failed
- who fixed/broke which tests
- which tests took longer time
- the success rate for each package/test suite/namespace
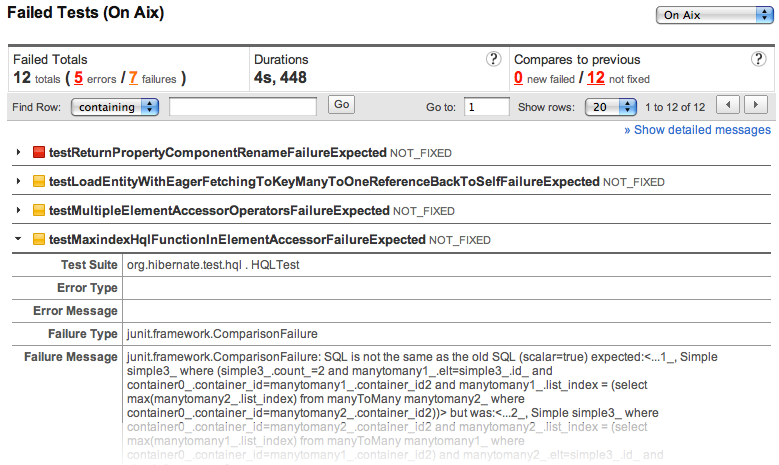
- the failure message/stack trace for failed tests
- test results for different platform
Statistics test reports can help the team to know:
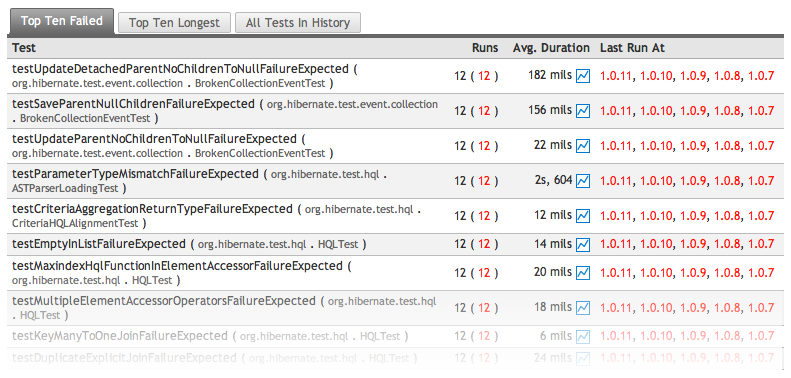
- the top ten failed tests
- the top ten longest tests
- the history of each test
- the durations history of each test in last 25 builds
- the trends of the tests/errors/failures/durations, etc.
Test results in build overview
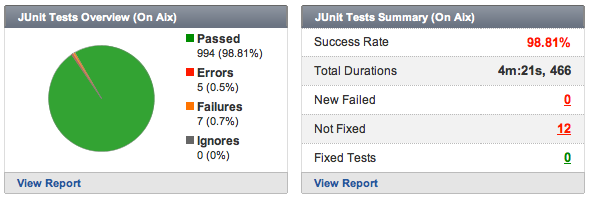
Test results in build overview page summarize the data of each build.
QuickBuild is able to process multiple set of test cases. For example, you may instruct QuickBuild to display your tests by platforms when your product generates test reports on different platforms.
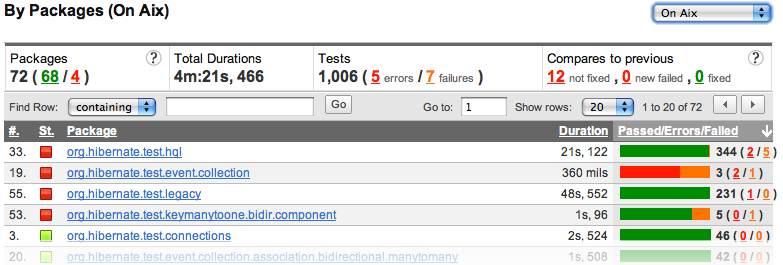
Packages/Namespaces/Test suites
QuickBuild also groups the test results according their package, namespaces, or test suites. From these kind of views, we can find/filter the test results easily.
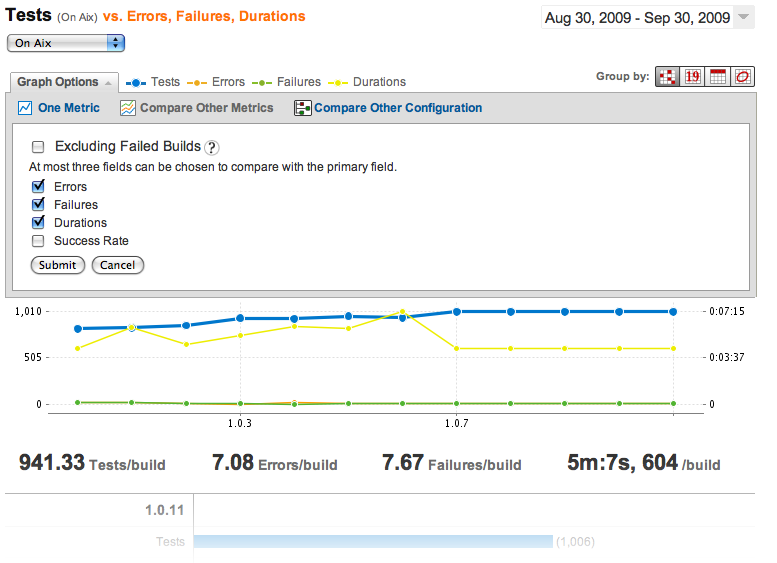
Statistics chart of test results
The statistics chart of test results helps you analyzing project health across your development life-cycle. You can compare different metrics, with different configurations, in different date range. Also, you can group the data by version, by date, by week or by month.
Test Trends
The test trends helps the team to know: which tests failed most frequently, which tests took longest time, and duration trend of each test in last 25 builds.
Support main stream unit test framework
Native support for mainstream unit tools including JUnit, TestNG, NUnit, MBUnit, MSTest, Boottest, and more will be added. Customer may also write custom plugin to support any other unit test frameworks, and this task has been made trivial by extending the xUnit plugin provided by QuickBuild.